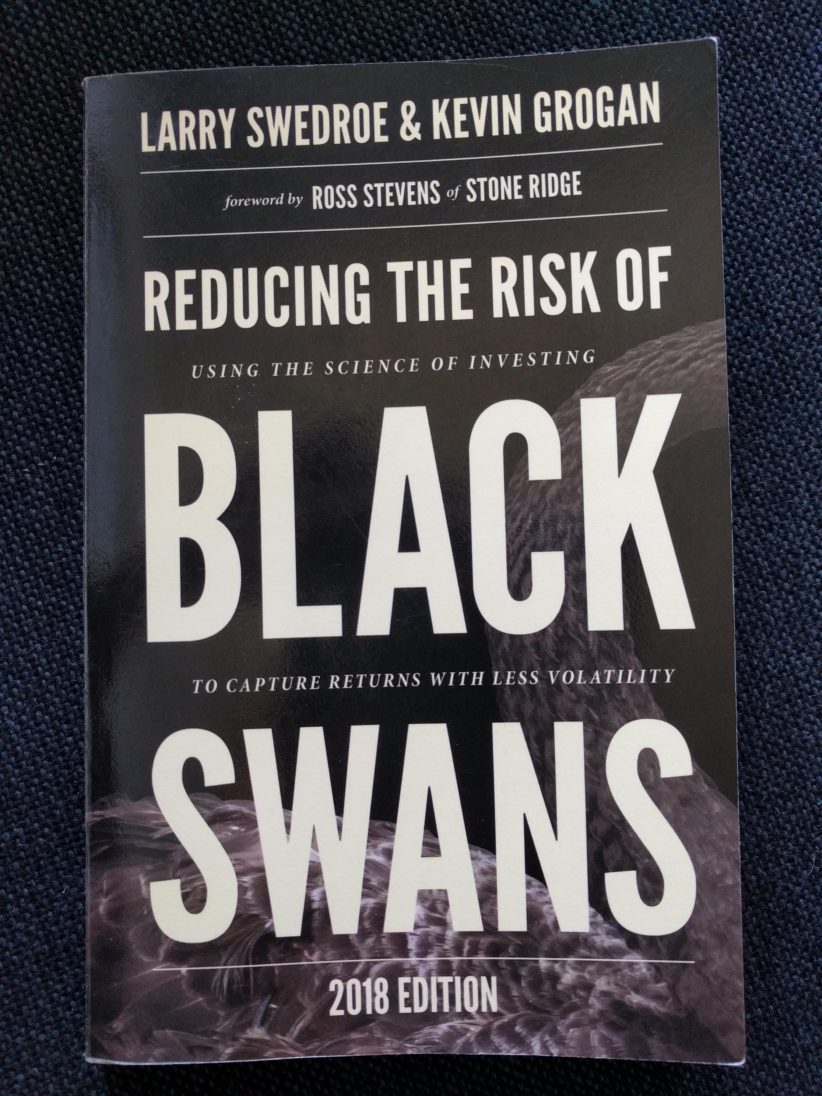
The gifts of the WCI Con 20 swag bag just keep on giving! Sheltering in place has provided ample reading time to sneak in some continuing financial education, currently on how achieve desired returns with reduced volatility. I'm currently reading Swedroe and Grogan's 2018 edition of Reducing the Risk of Black Swans, which has the most lucid explanation of correlation I've ever read.
In case the timely title is not sexy enough to catch your attention, I'll paraphrase their explanation as a teaser to encourage more of you pick up this fascinating, evidence-based read.
Correlation among asset classes is important to understand in order to create a portfolio with reduced volatility. Let's take two theoretical assets, A and B. Each has a tendency to produce returns that will be either above or below its unique average.
If A and B are positively correlated, then when A produces above average returns, B is also likely to produce above average returns. Correlation cuts both ways, however, meaning that when A produces below average returns, B is also likely to produce below average returns. The stronger this likelihood, the closer the correlation between A and B will be to 1.
If A and B are negatively correlated, then when A produces above average returns, B is likely to produce below average returns (and vice versa). The stronger this likelihood, the closer the correlation between A and B approaches -1. Note that we are describing probabilities, not immutable laws. A negative correlation is not a guarantee that when A zigs, B will zag; rather it suggests that when A zigs, B is more likely to zag.
Here's where most investors get a bit confused. The ideal portfolio is not composed of negatively correlated assets, but rather, one composed of uncorrelated assets. What's the difference? If A and B are uncorrelated, then when A produces above average returns, B's returns are equally likely to be above or below average, independent of A's returns. Their correlation is zero.
Let's use a sample of a 4 year sequence of returns to illustrate: A has returns of 8%,12%,8%,12%, for a positive average annual return of 10%. During those same 4 years, B has returns of 12%,8%,12%,8% for a positive average annual return of 10%. Looks like A and B are negatively correlated. You'll also note that both produced positive returns.
In our second 4 year sample, A has returns of 3%,-3%,3%,-3%, for an average annual return of zero percent. During those same 4 years, B has returns of -3%,3%,-3%,3%, also for an average annual return of zero percent. A and B both produce annual returns of zero percent, and they remain negatively correlated.
Now for the financial hat trick. Let's sum these two 4 year series into a single 8 year sample for each asset.
Returns for A: 8,12,8,12,3,-3,3,-3.
Returns for B:12,8,12,8,-3,3,-3,3.
Average 8 year returns for A are 4%. Average 8 year returns for B are also 4%. Uh oh, weren't these assets negatively correlated? Nope! We know that over 8 years they each have an average return of 4%. In the first series, during the 4 years when A provided above average returns, B also achieved above average returns. In the second series, during the 4 years when A provided below average returns, B also achieved below average returns. This suggests a positive correlation over a longer series. Mind blown.
Lesson: Correlations are only meaningful if examining a series of data over a long period of time.
The authors go on to impart a second lesson, one that is not necessarily demonstrated by the example above but is important to keep in mind: in a market crash, the only thing that goes up is correlation. Put another way, during a time of crisis, correlations go to 1. I learned that one firsthand in 2008, when my REITs behaved like equities.
I encourage those of you who enjoy this type of discussion to check out Reducing the Risk of Black Swans, and let me know what you think!

